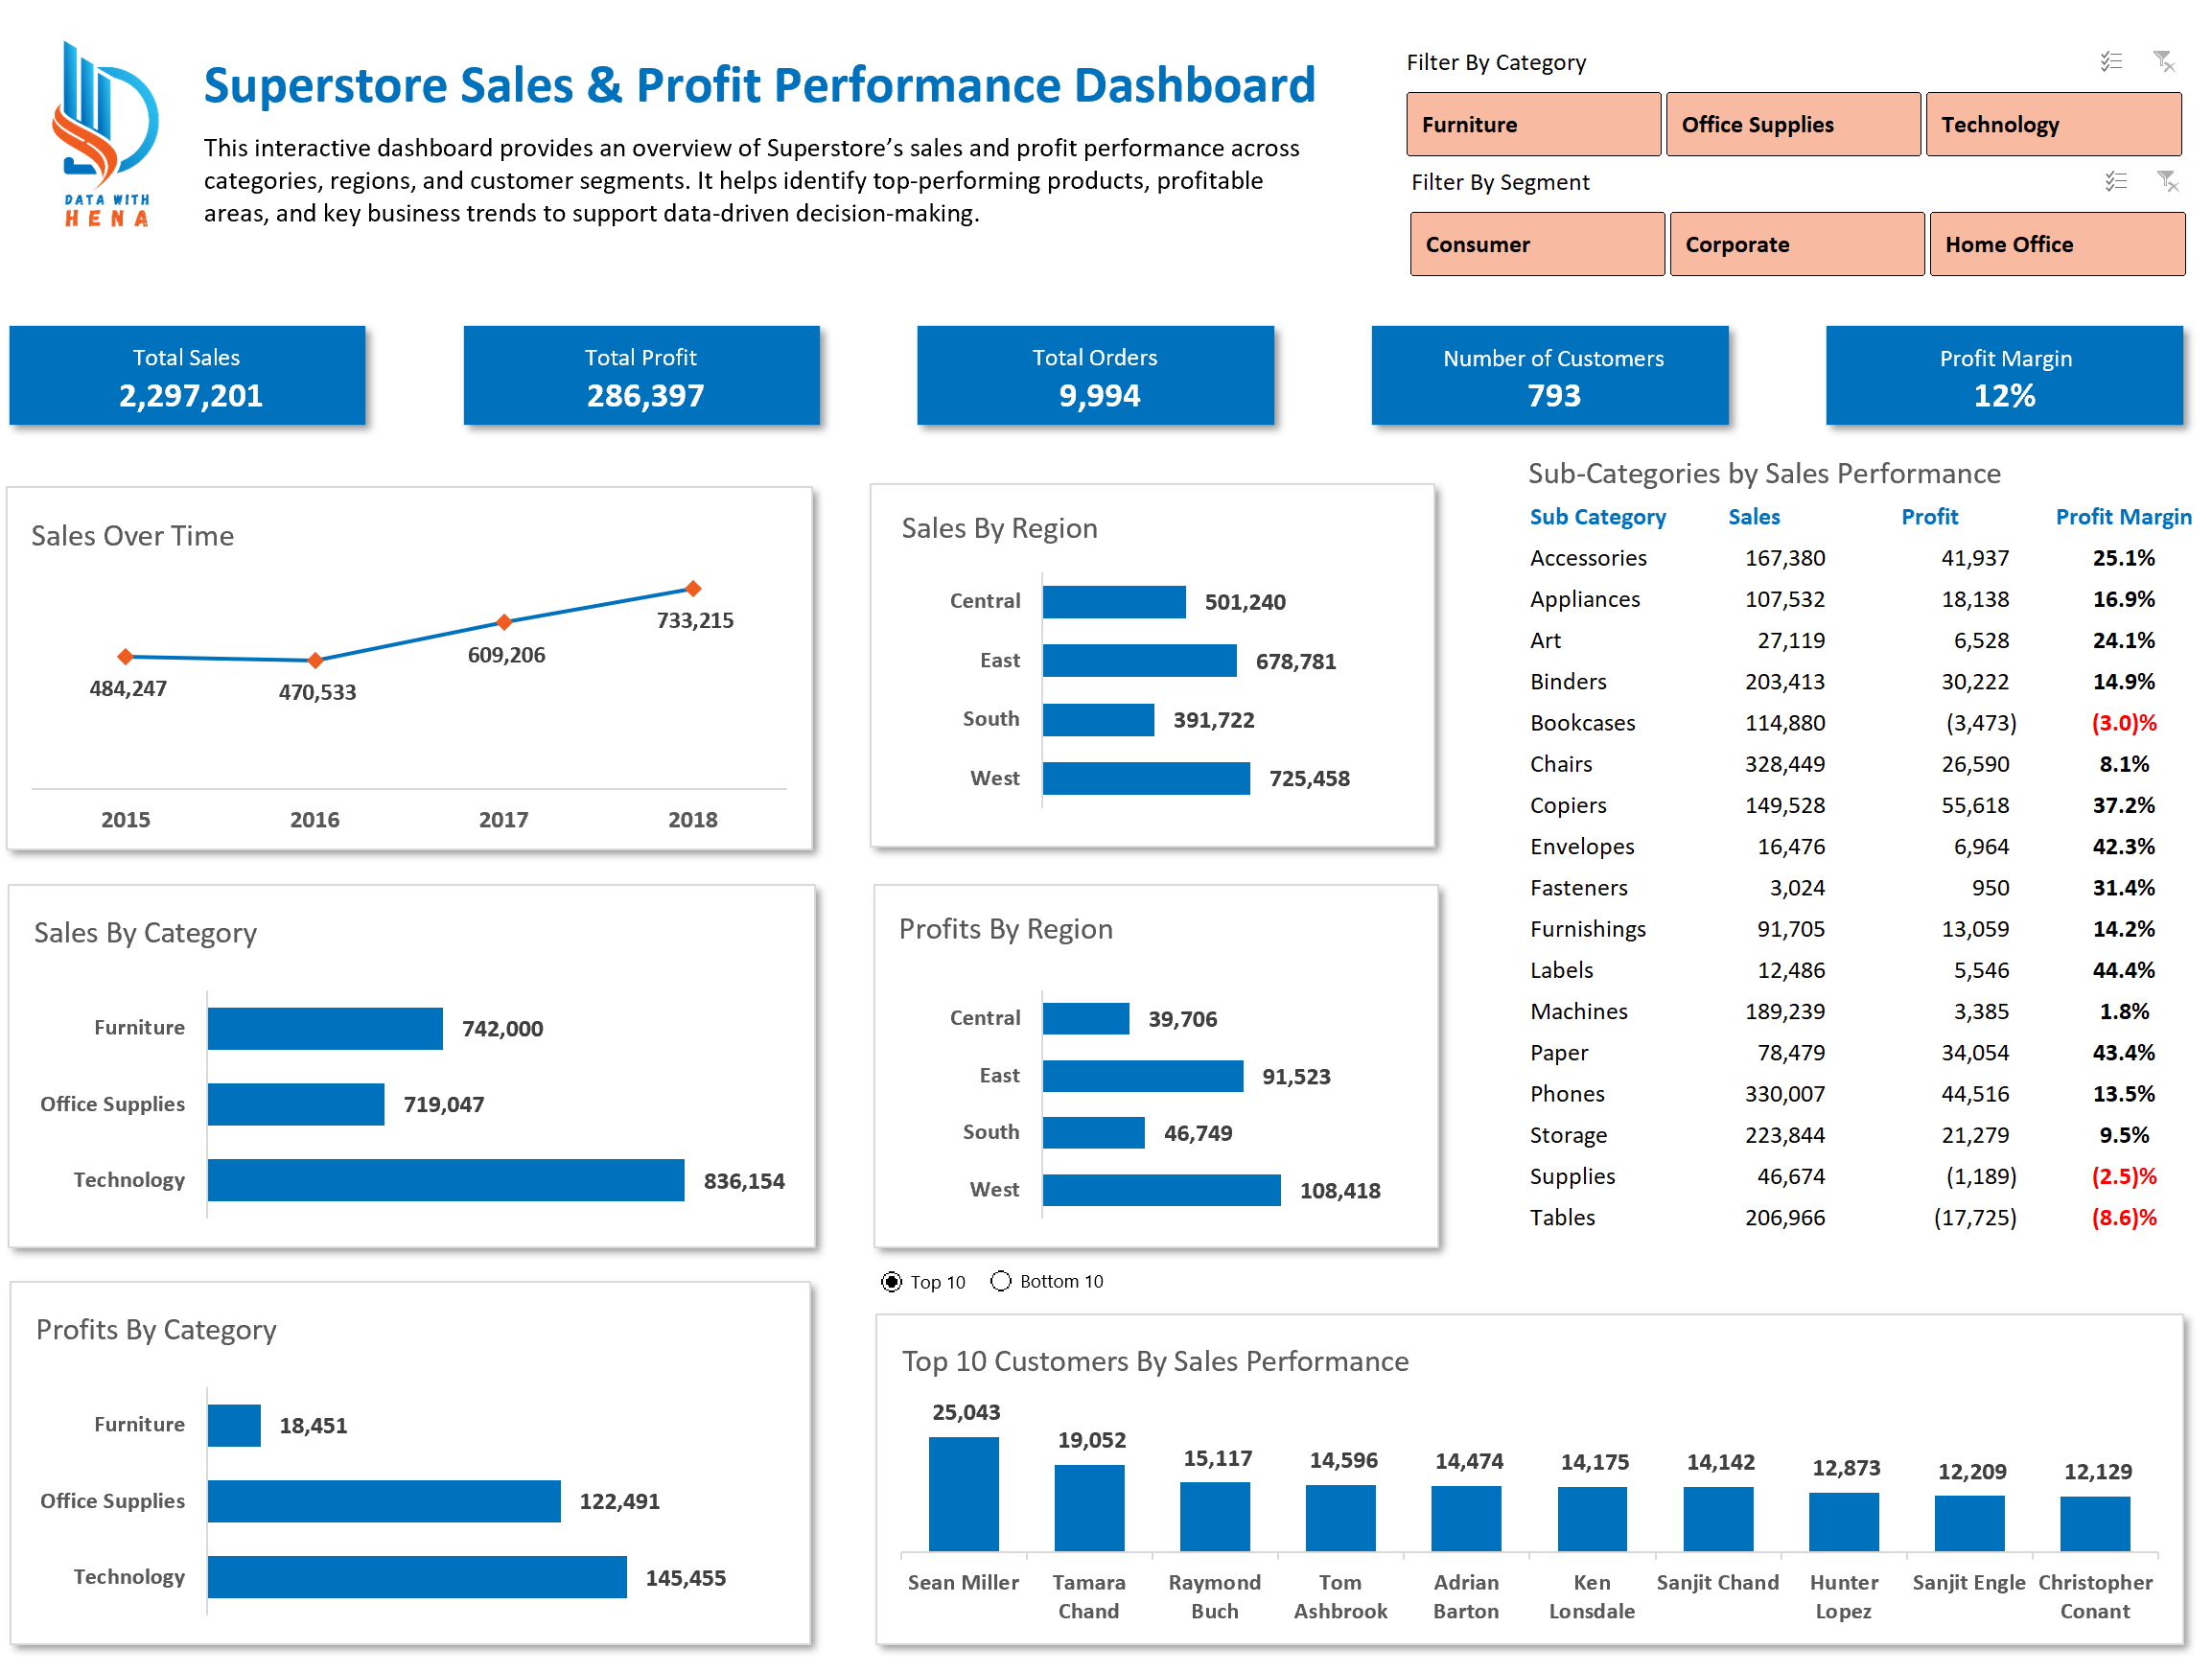
Superstore Sales & Profit Performance Dashboard
At a glance
- Project: Interactive Excel dashboard
- Date: January 2026
- Category: Data visualization
Project overview
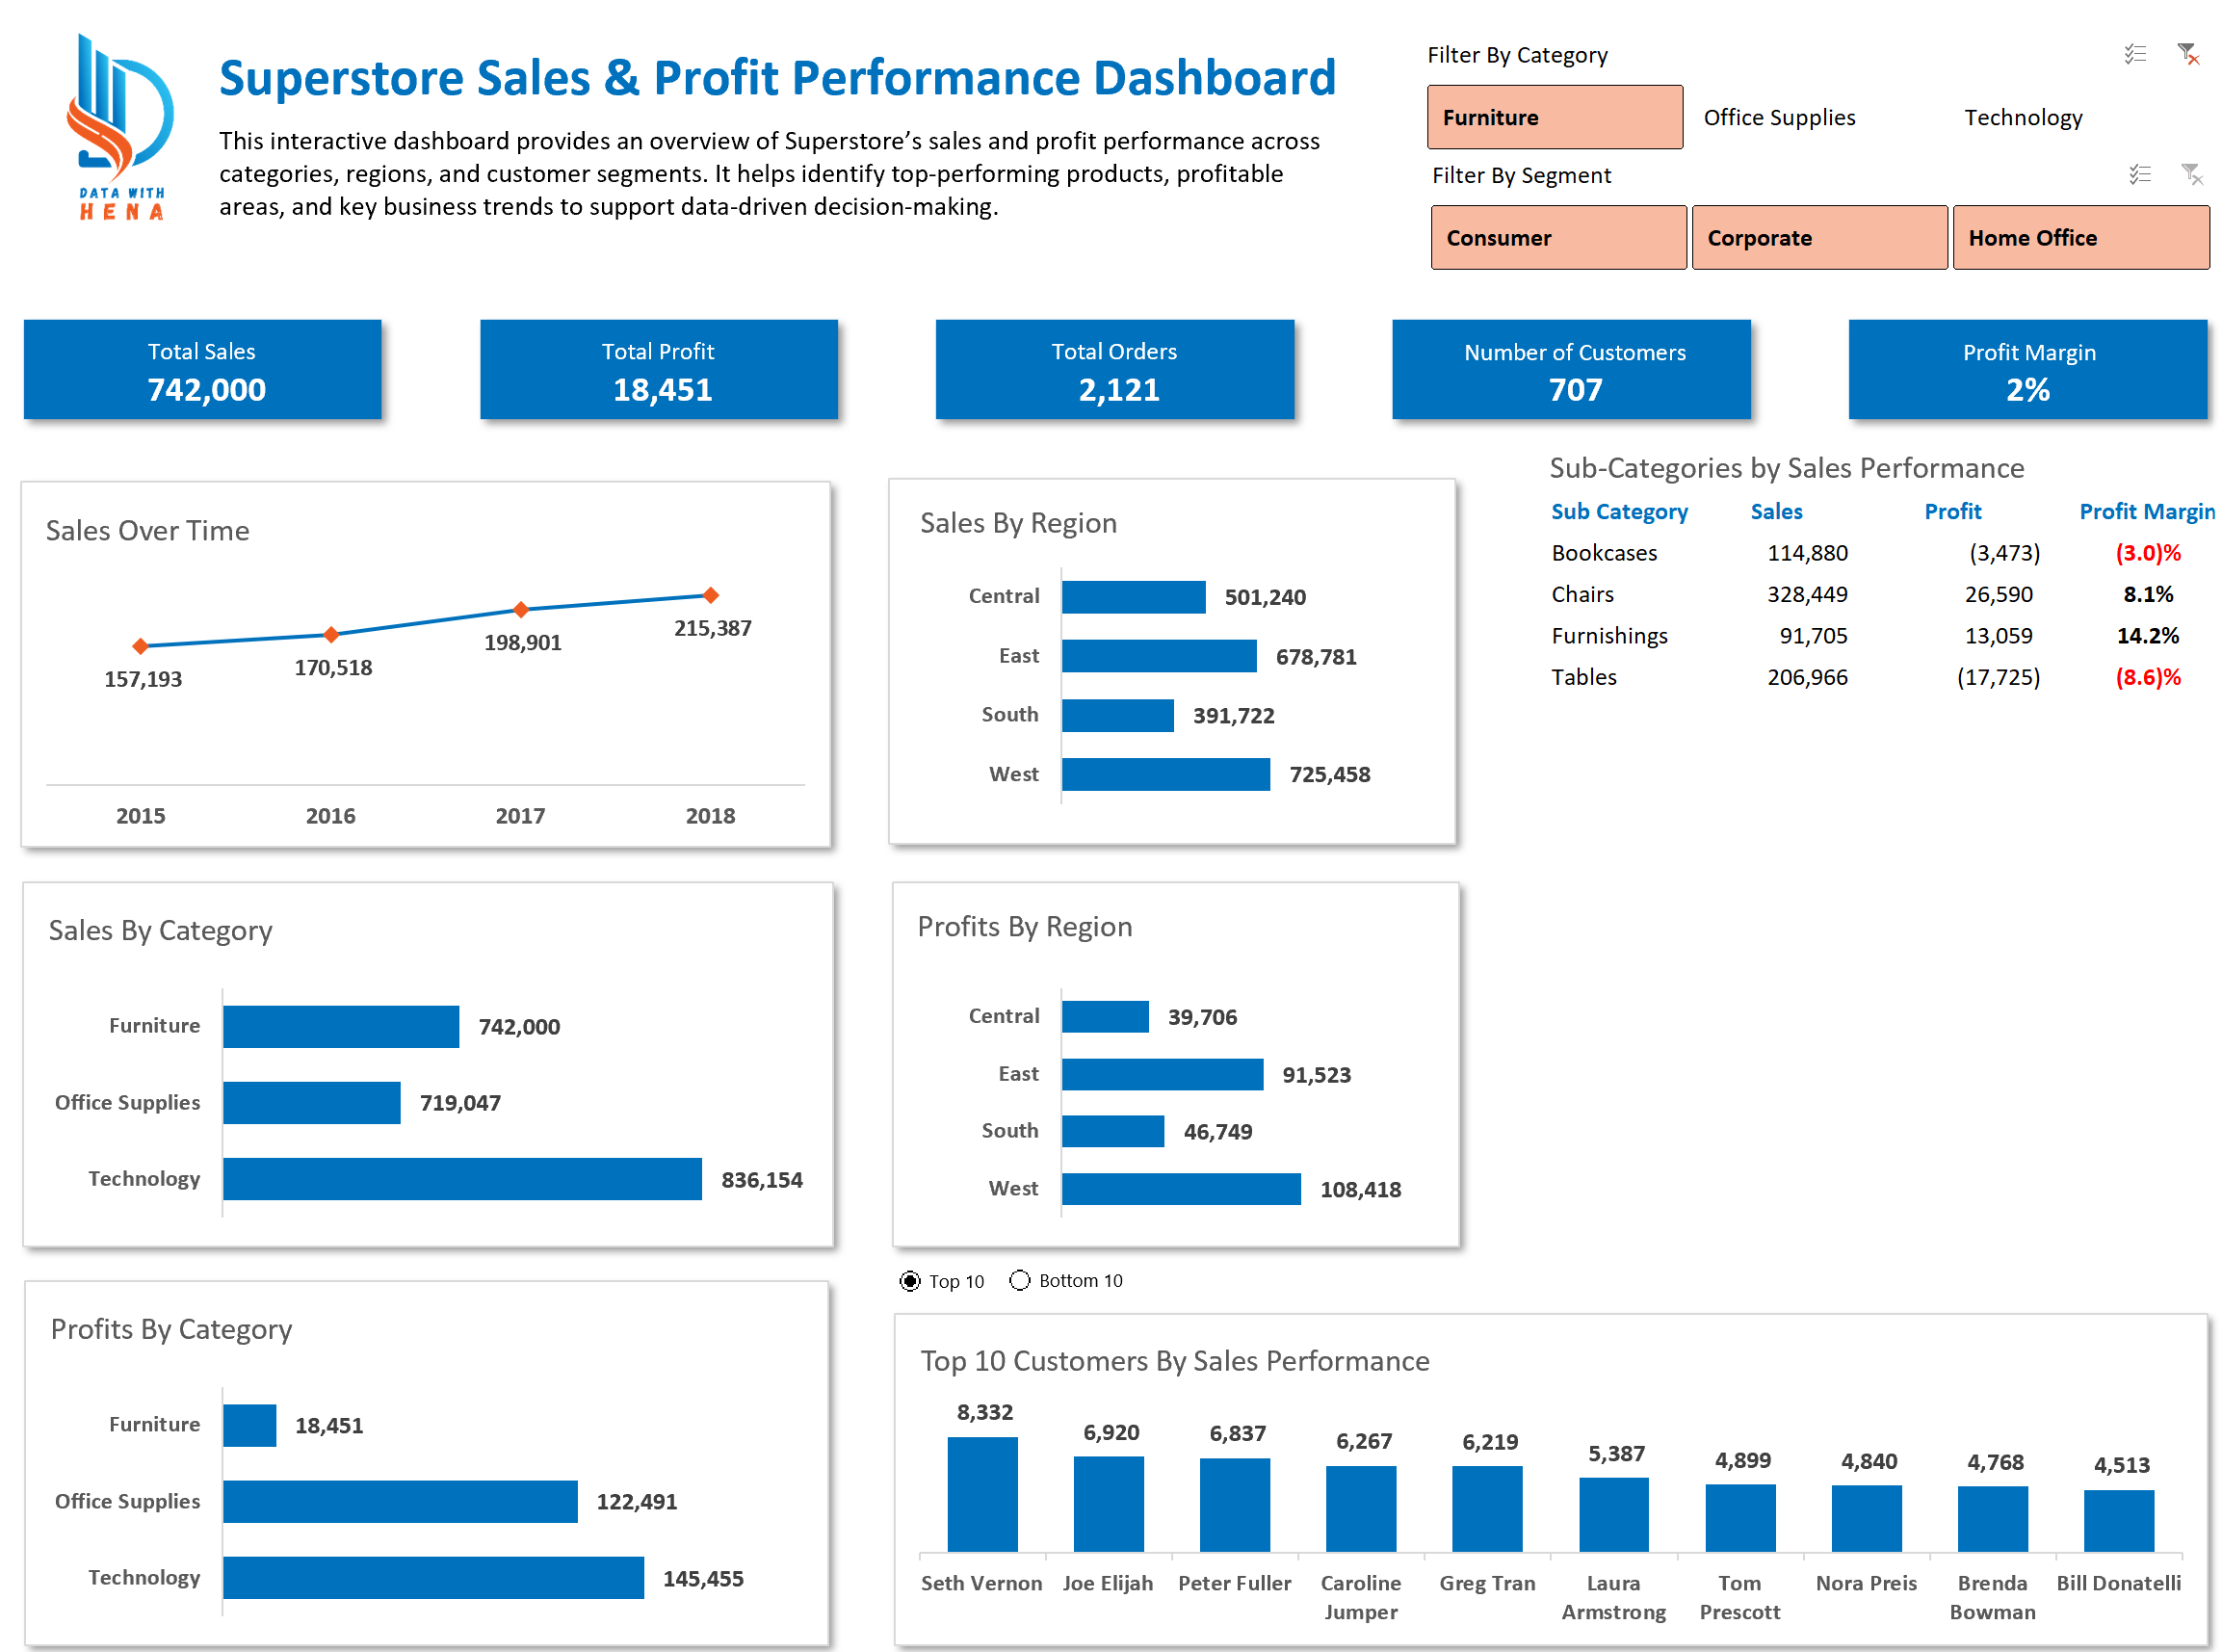
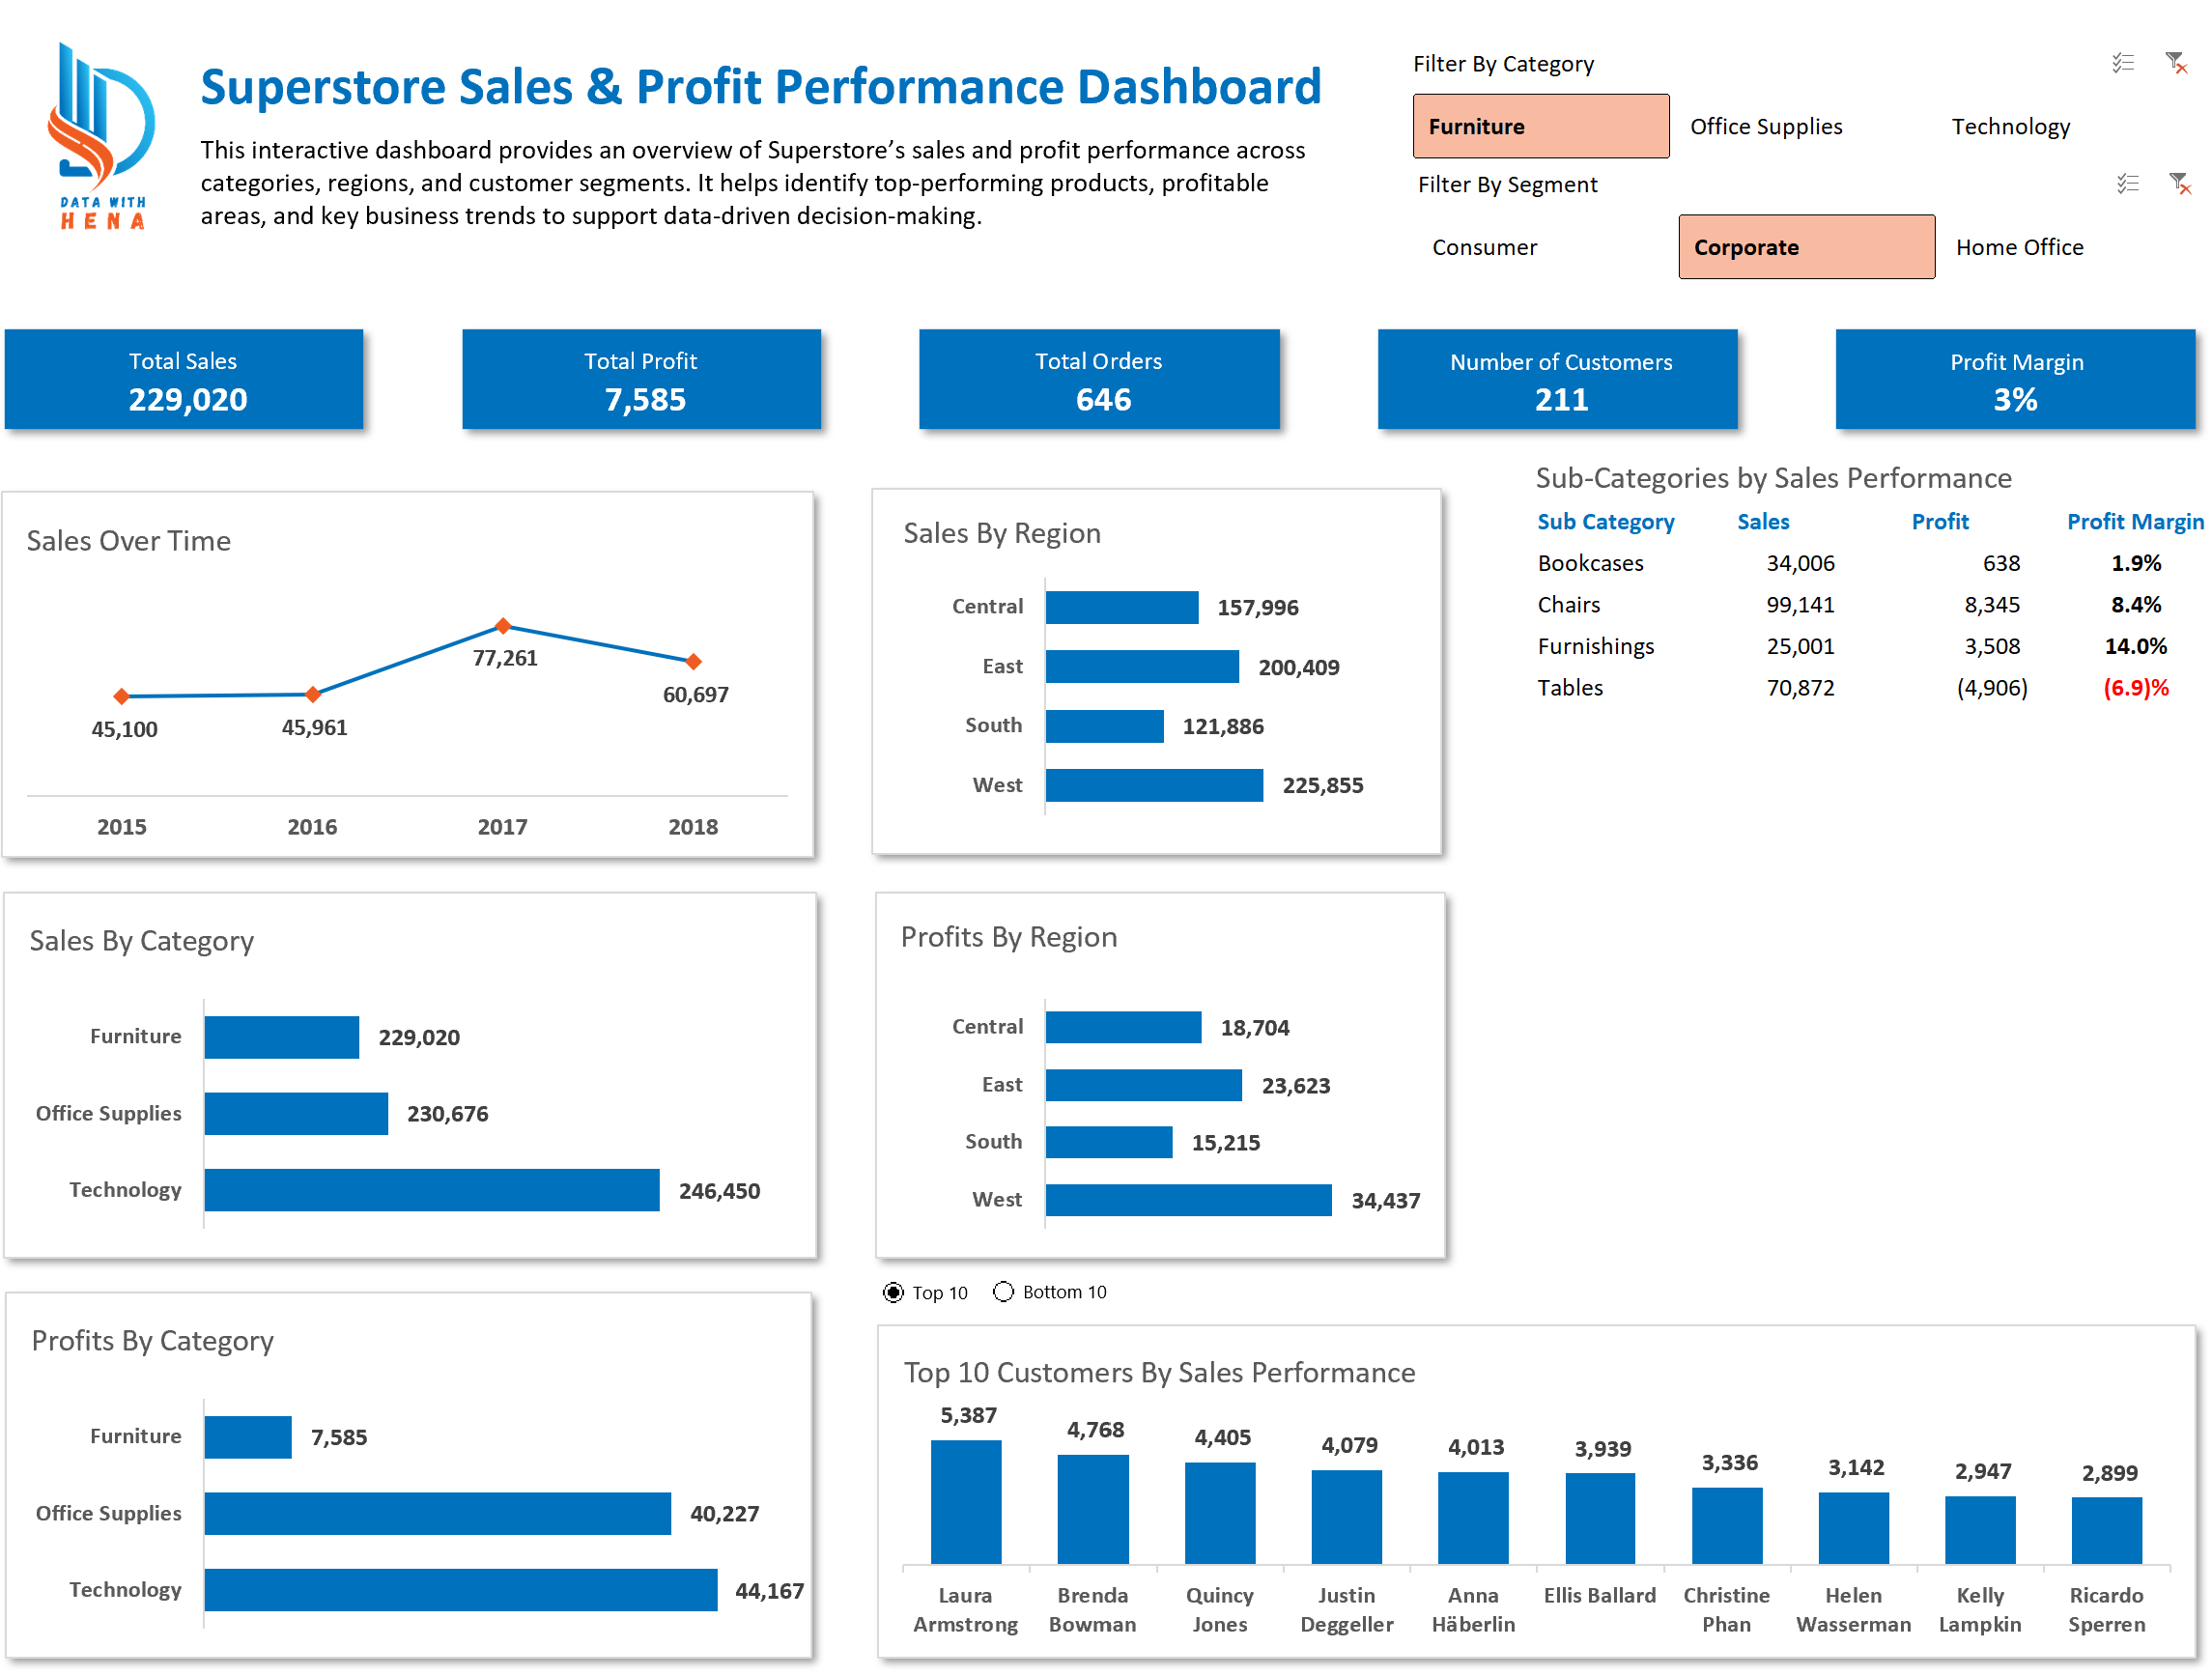
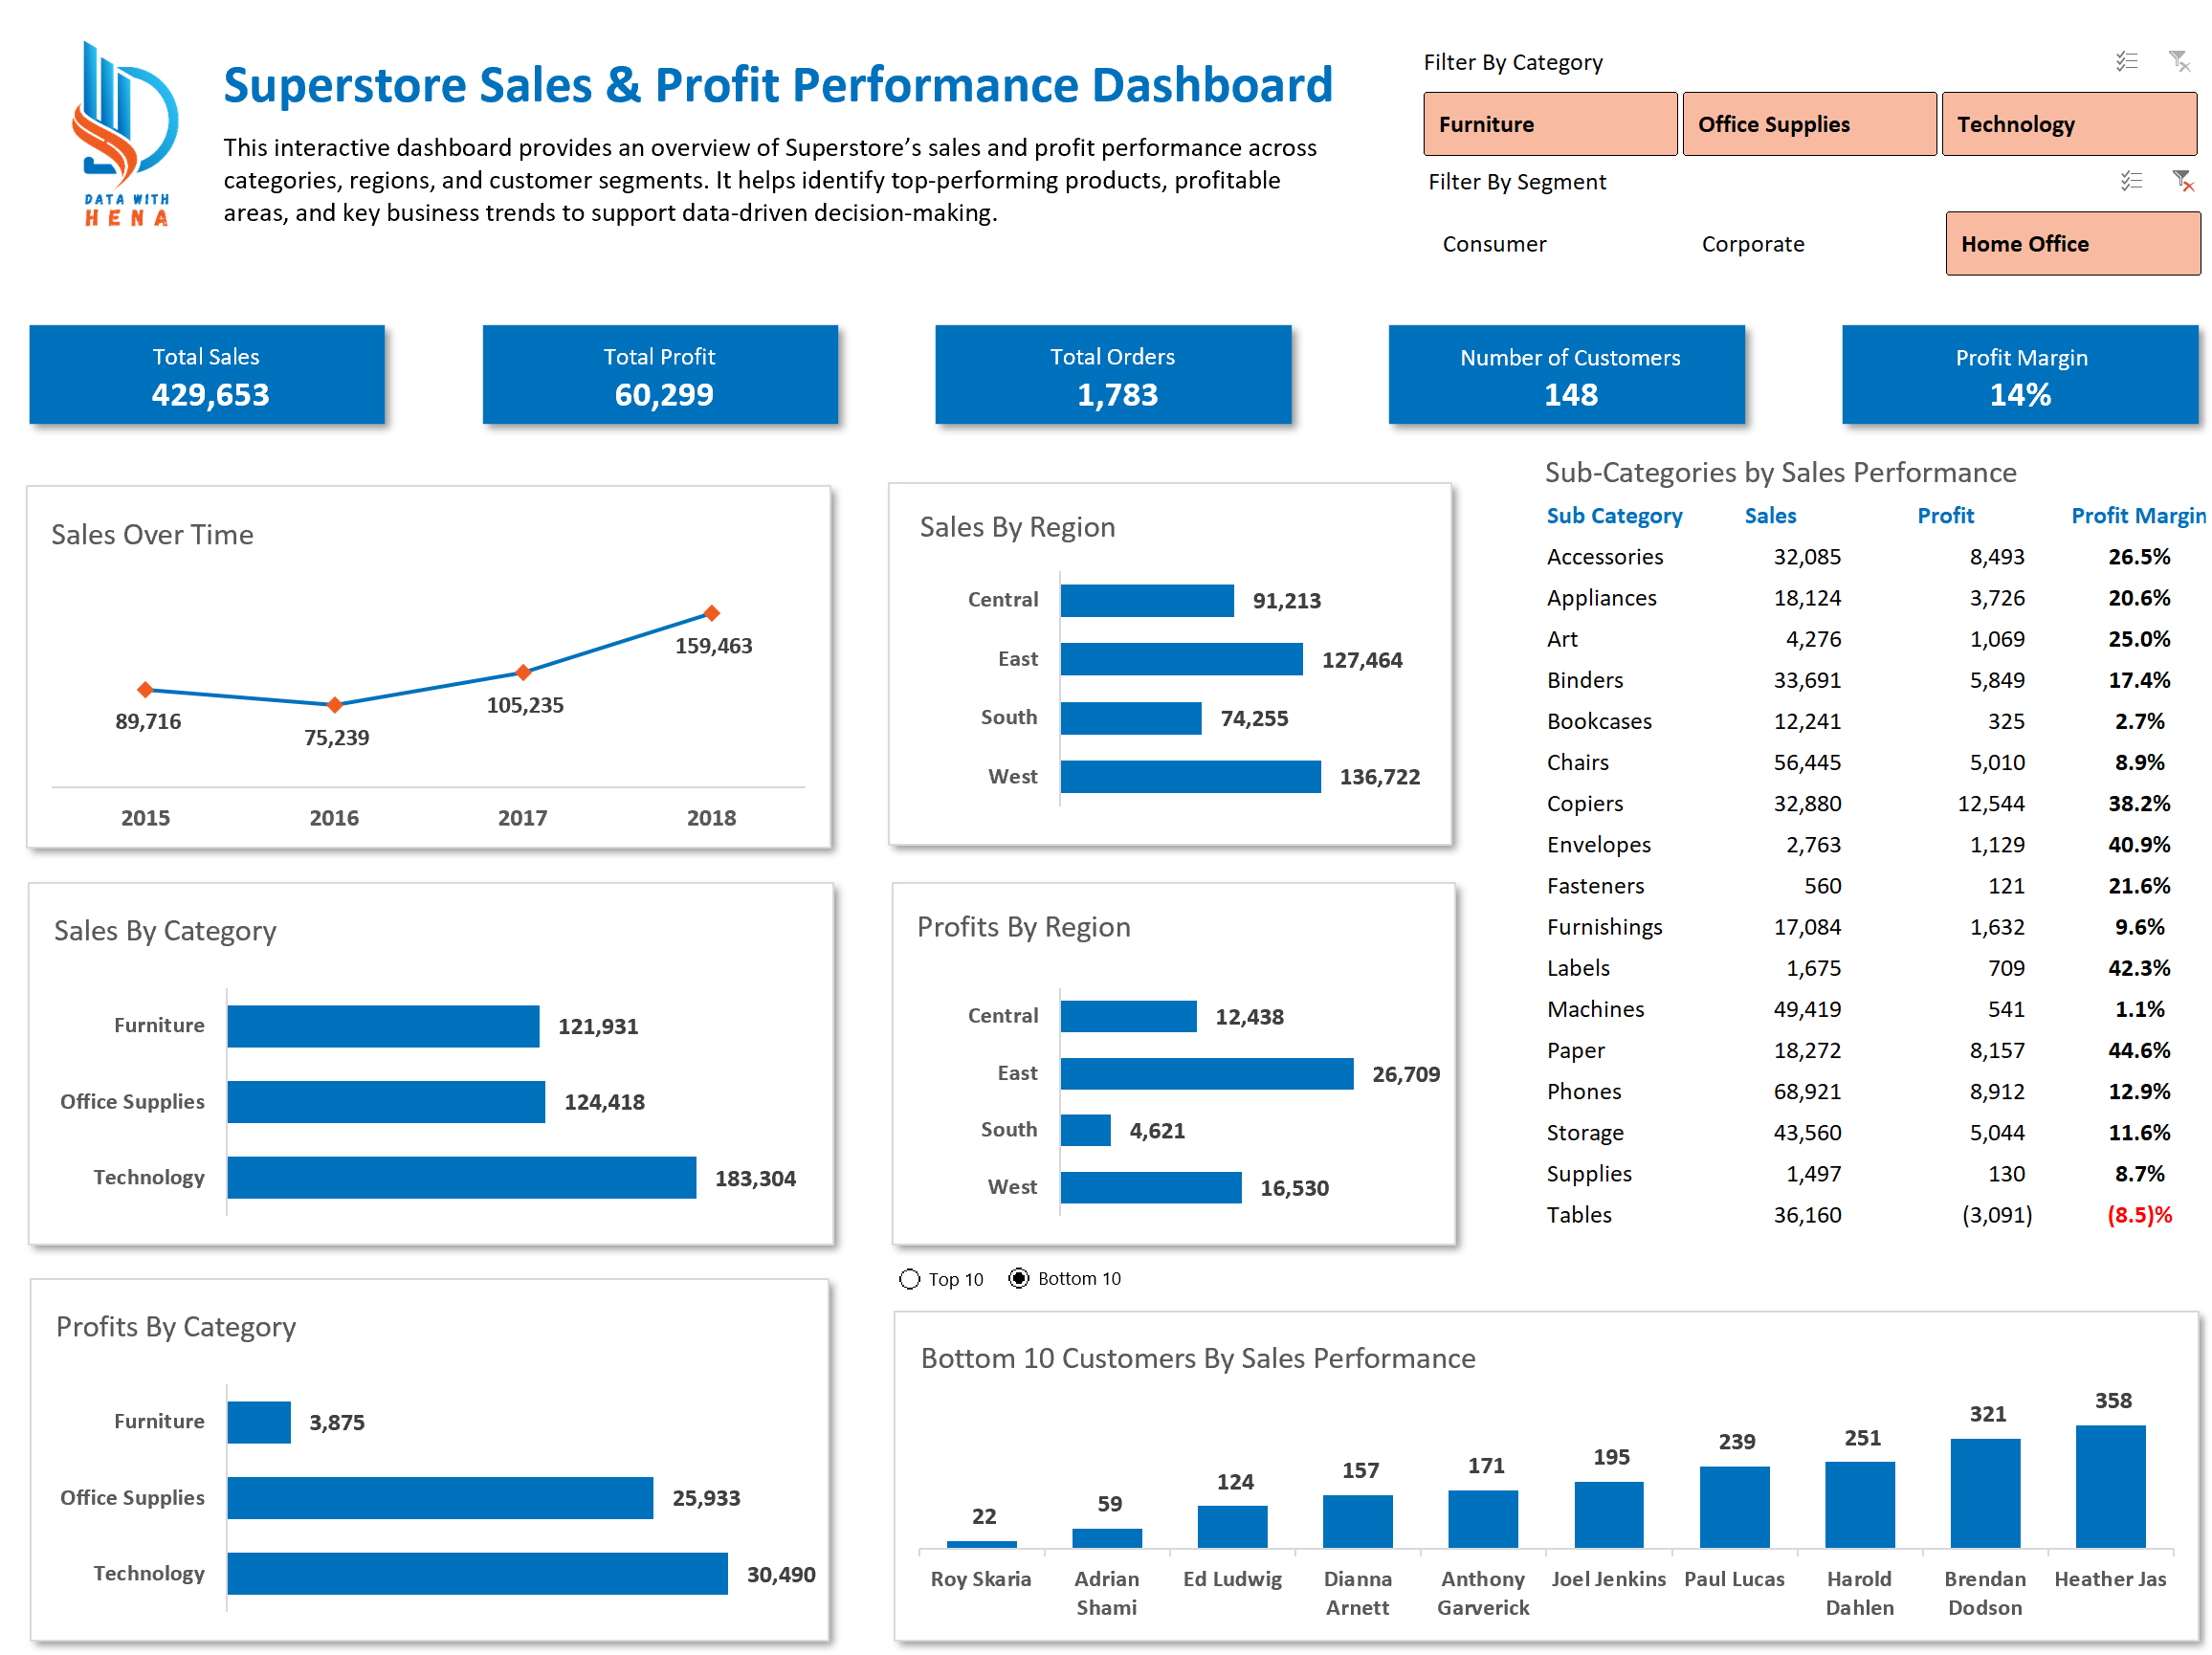
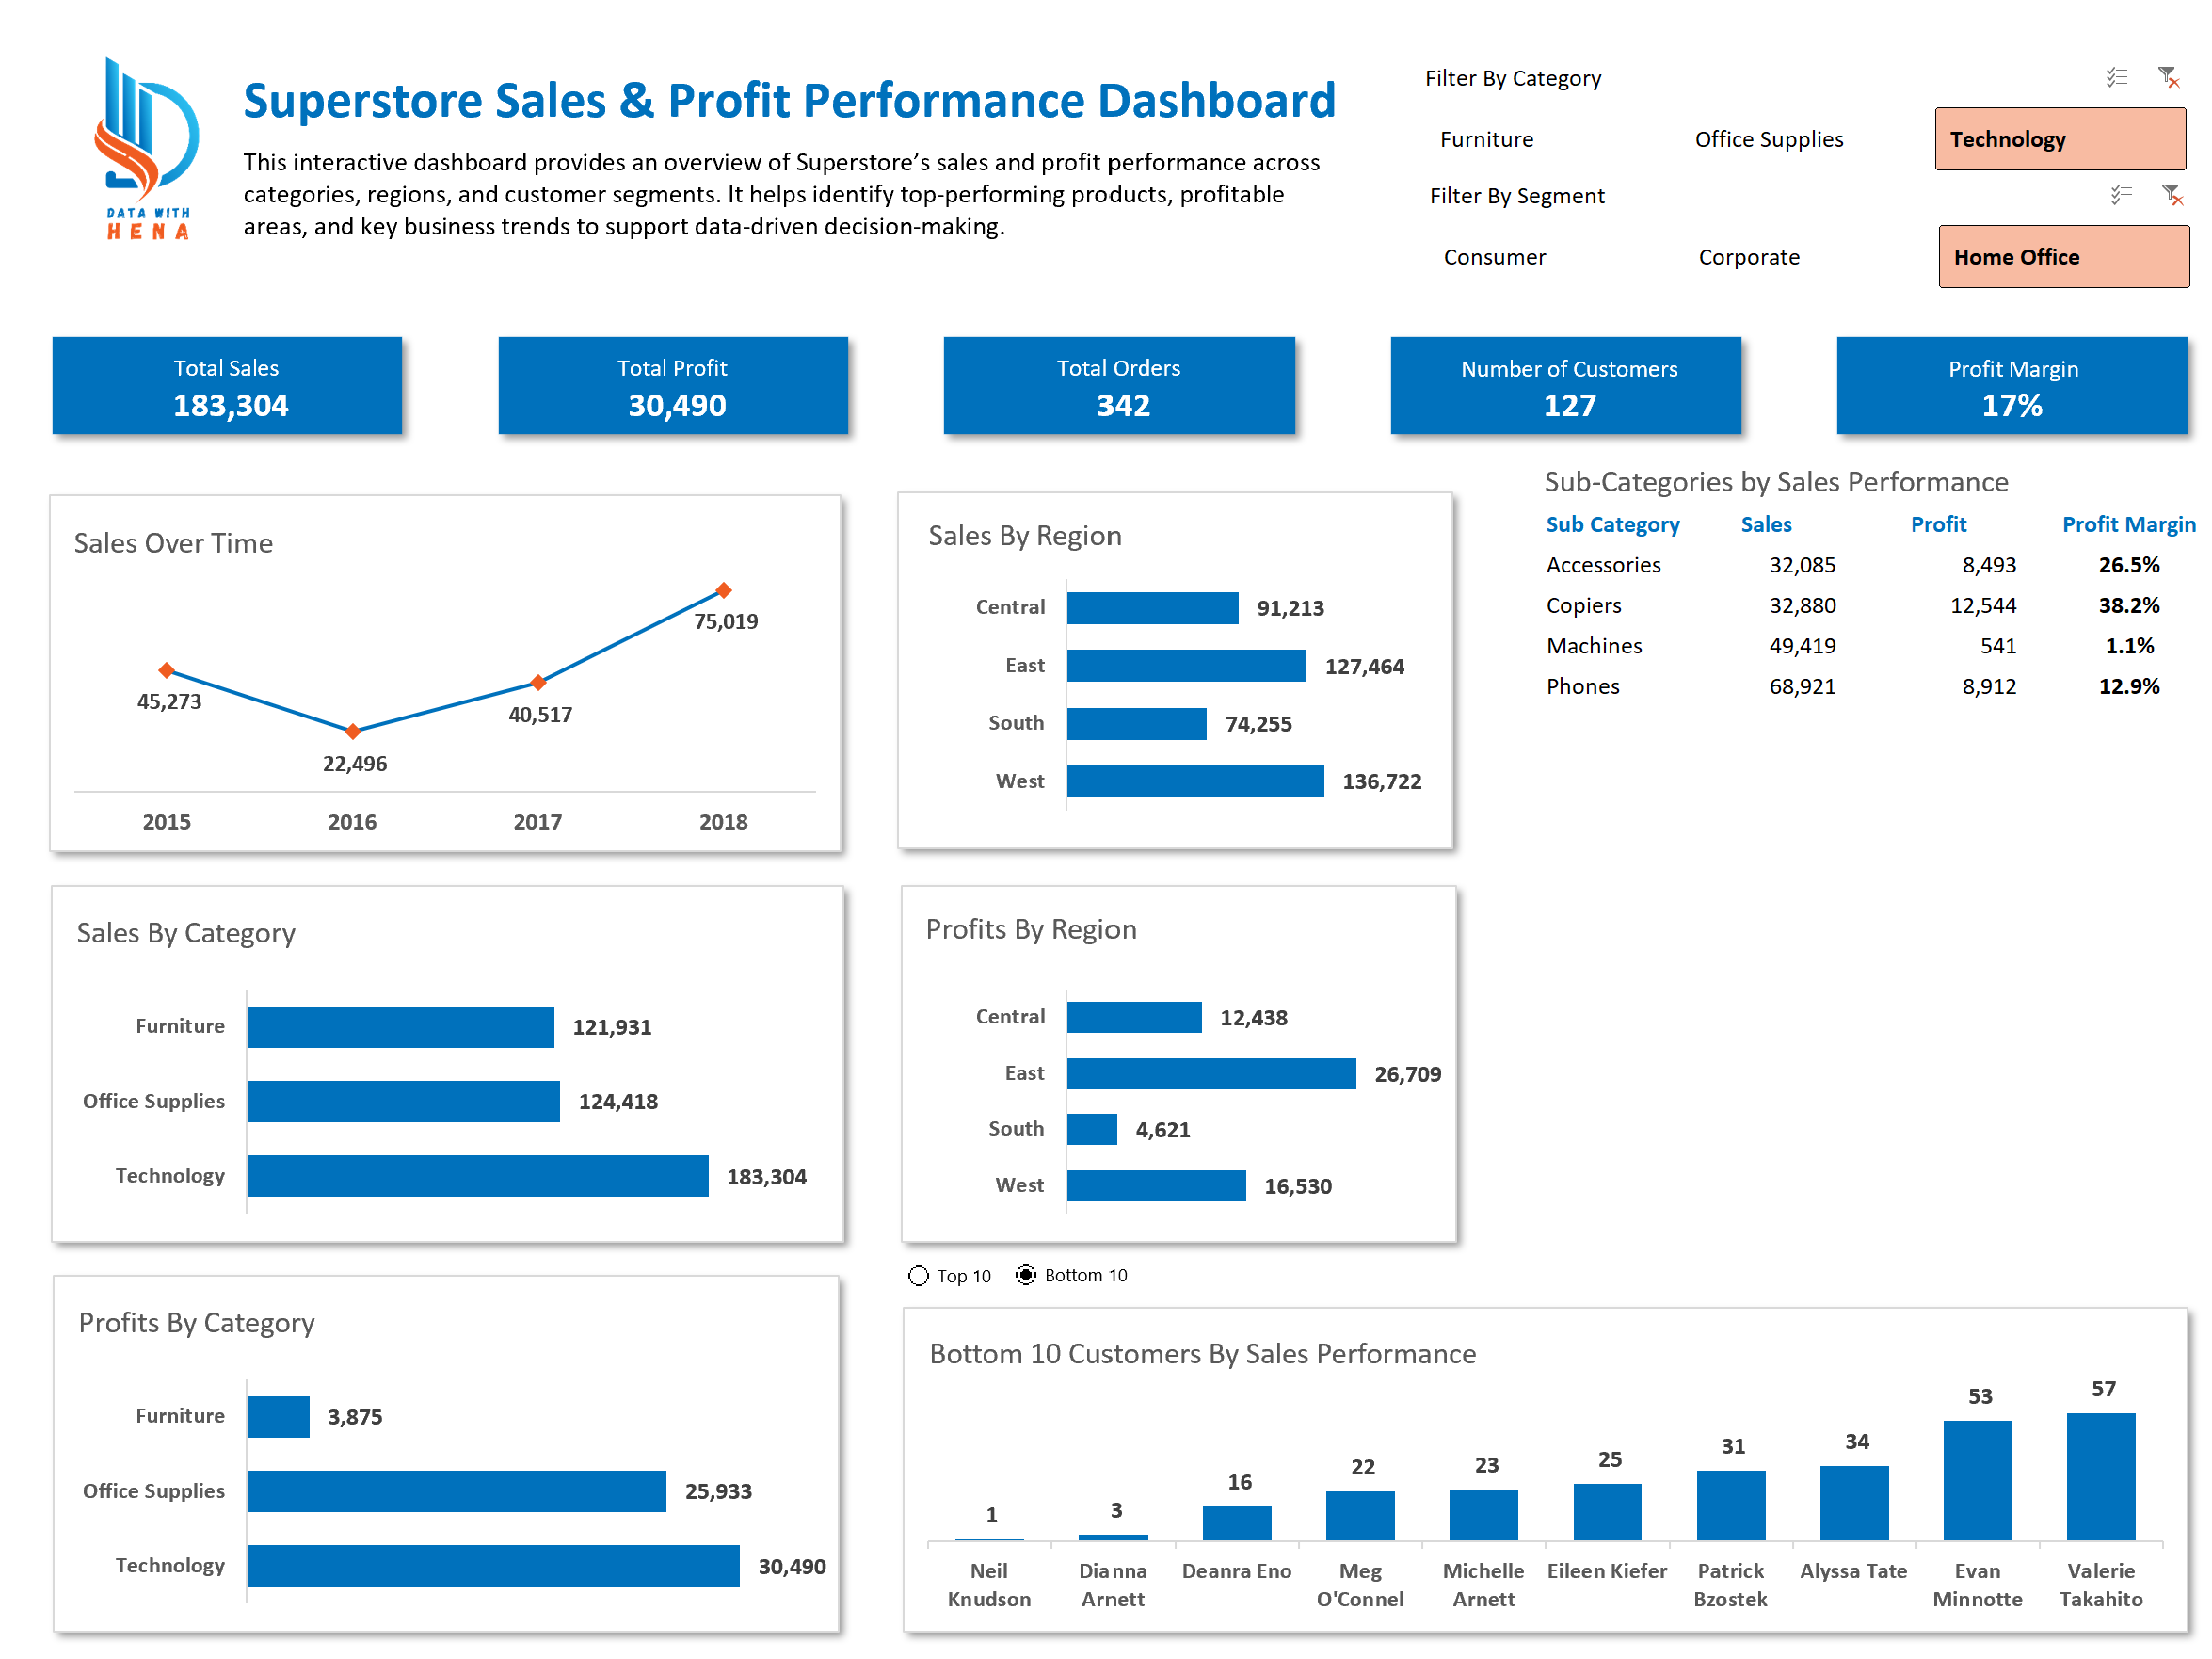
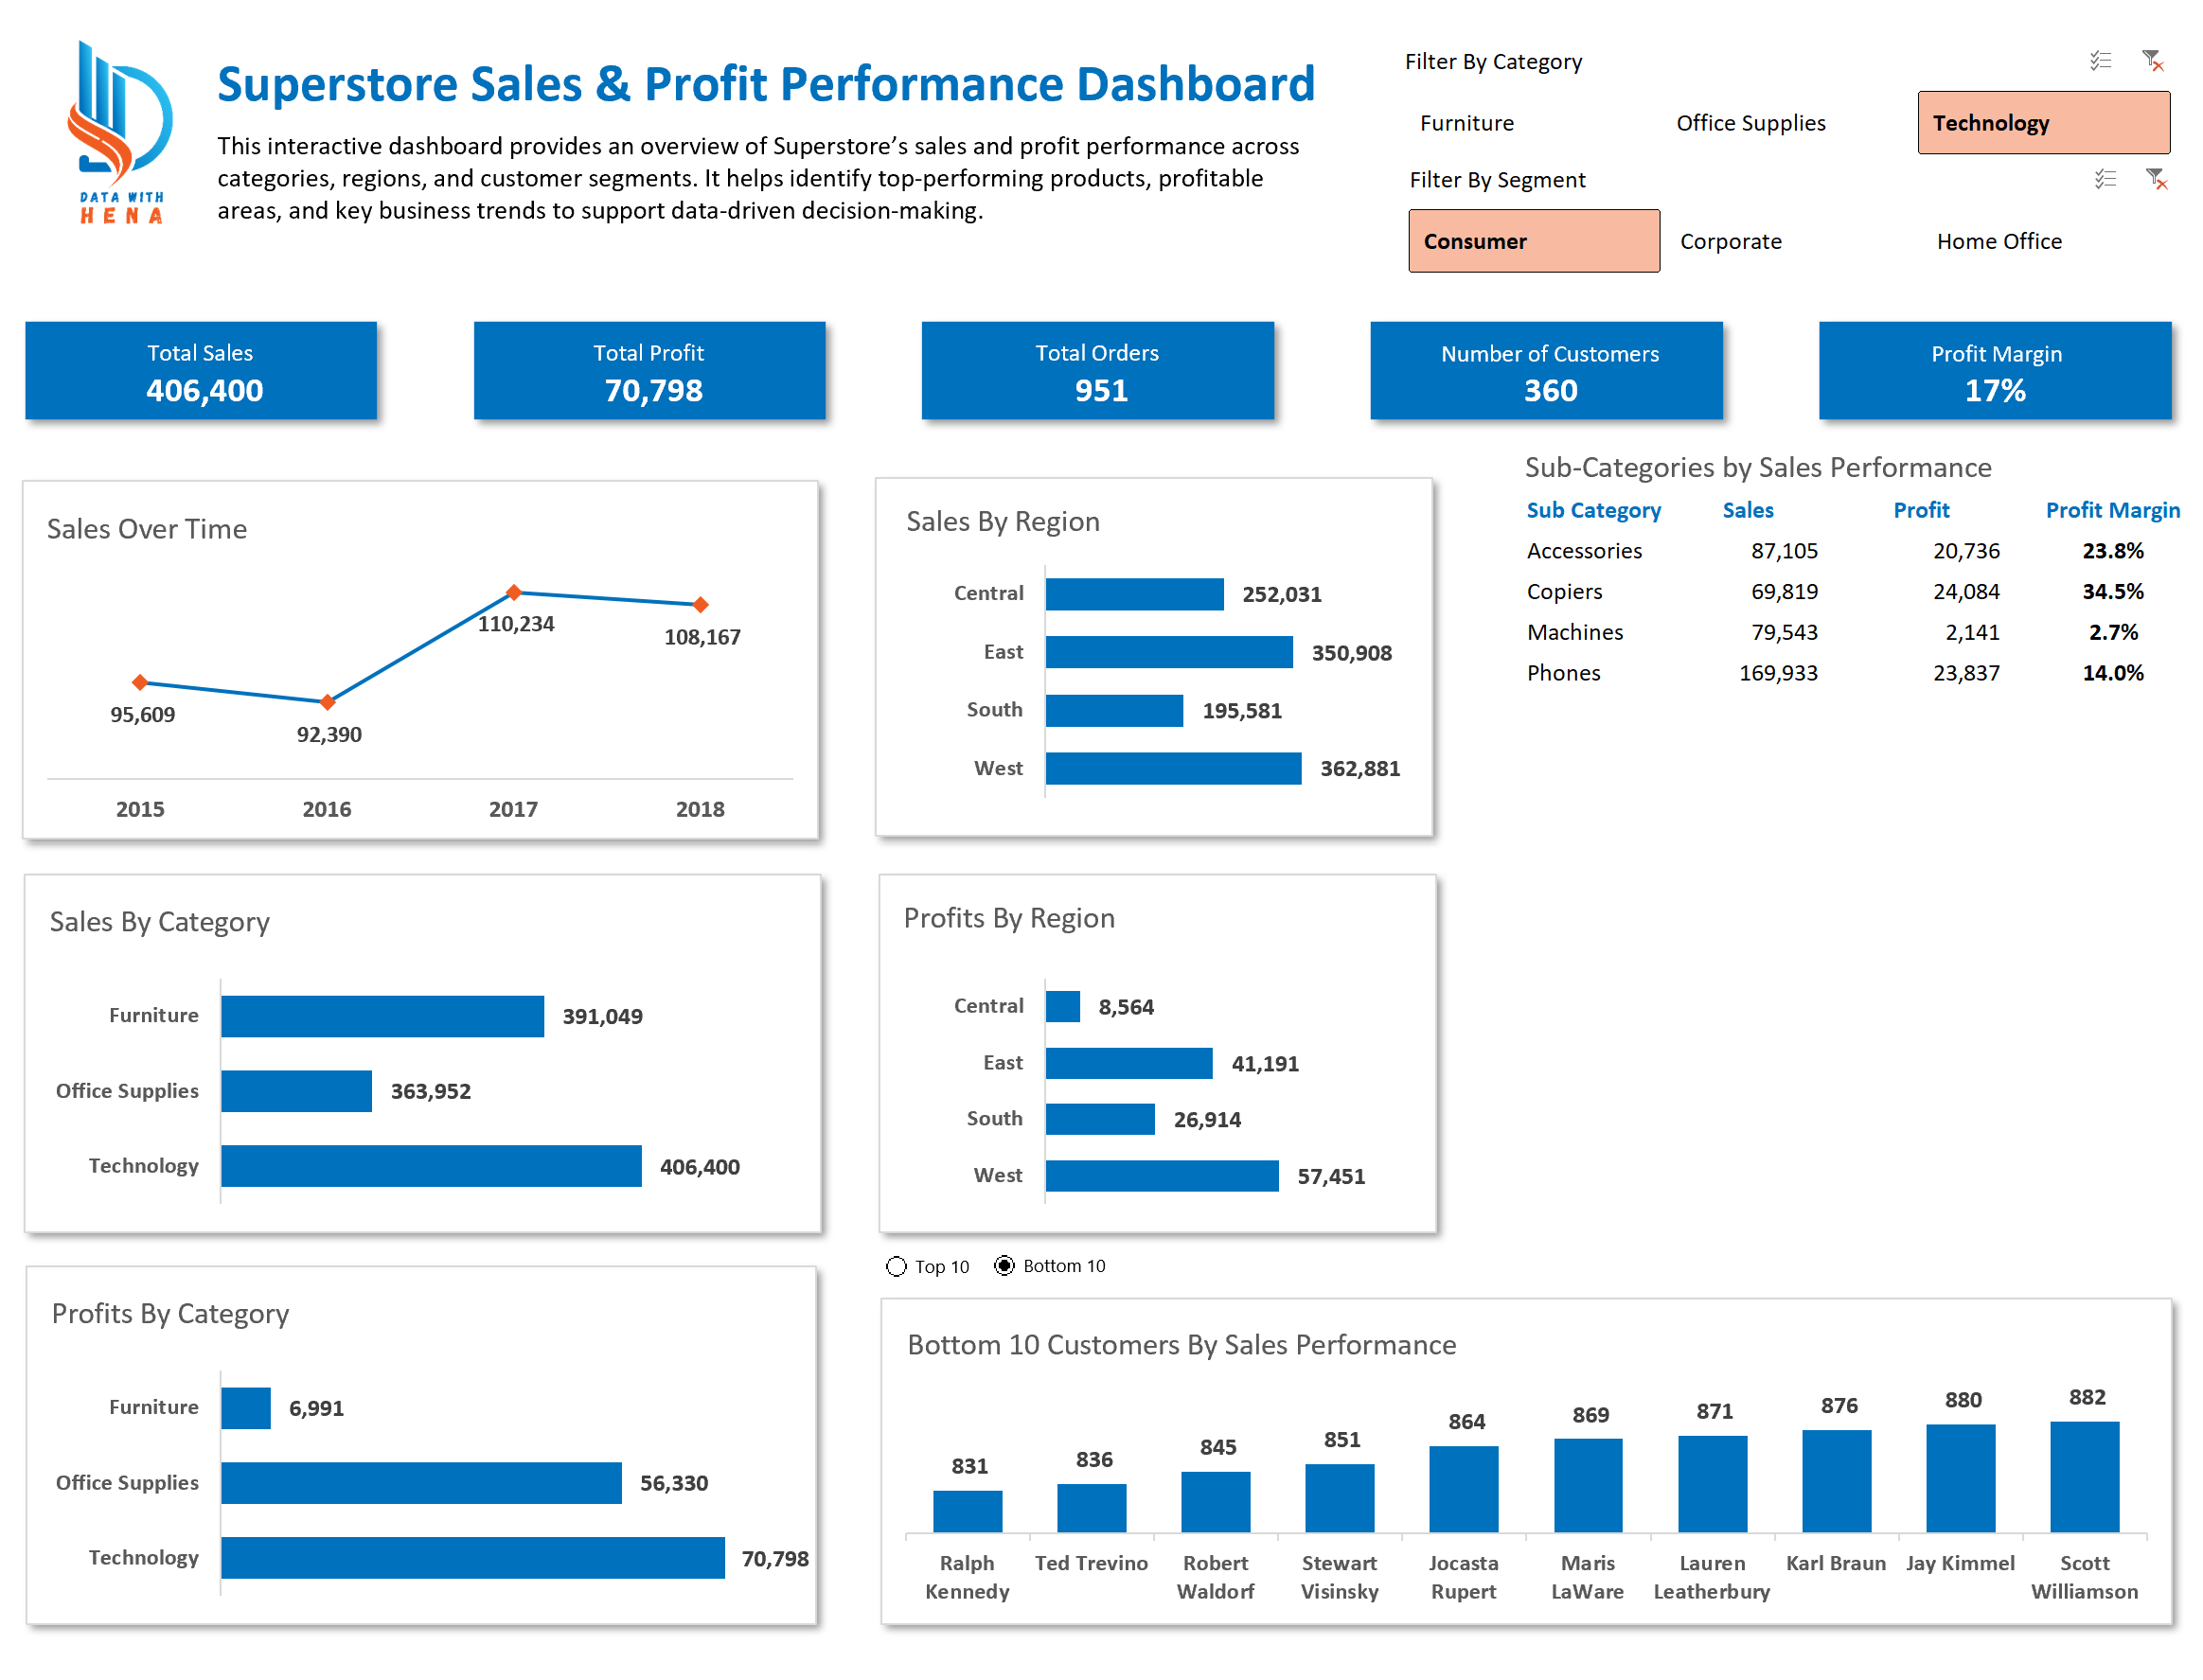
This project analyzes retail performance using the Sample Superstore dataset. An interactive Excel dashboard monitors sales, profit, and performance across products, regions, and customer segments.
The dashboard turns raw transactions into visual insights for data-driven decisions. Users can explore trends, compare categories, and spot strong and weak areas of the business.
Dataset / source
Sample Superstore dataset (transactional retail data with product, region, segment, and date fields).
Tools used
Microsoft Excel (tables, pivot tables, charts, slicers).
What problem you solved
Stakeholders needed one place to track sales and profit by category, region, and segment without working in raw spreadsheets.
Key insights
- Overview
Headline sales and profit metrics and trends. - Categories
Comparison of product category performance. - Regions
Geographic sales and profit patterns. - Segments
Consumer, Corporate, and Home Office views. - Trends
Time-based and categorical comparisons for opportunities and risk areas.
Browse through the dashboard views below. Full interactive Excel workbook available upon request.
Explore More Projects
Discover other data analysis projects and interactive dashboards
View All Projects